BI Cost & Capacity Optimization
Cut 20-25% off your BI bill in 90 days.
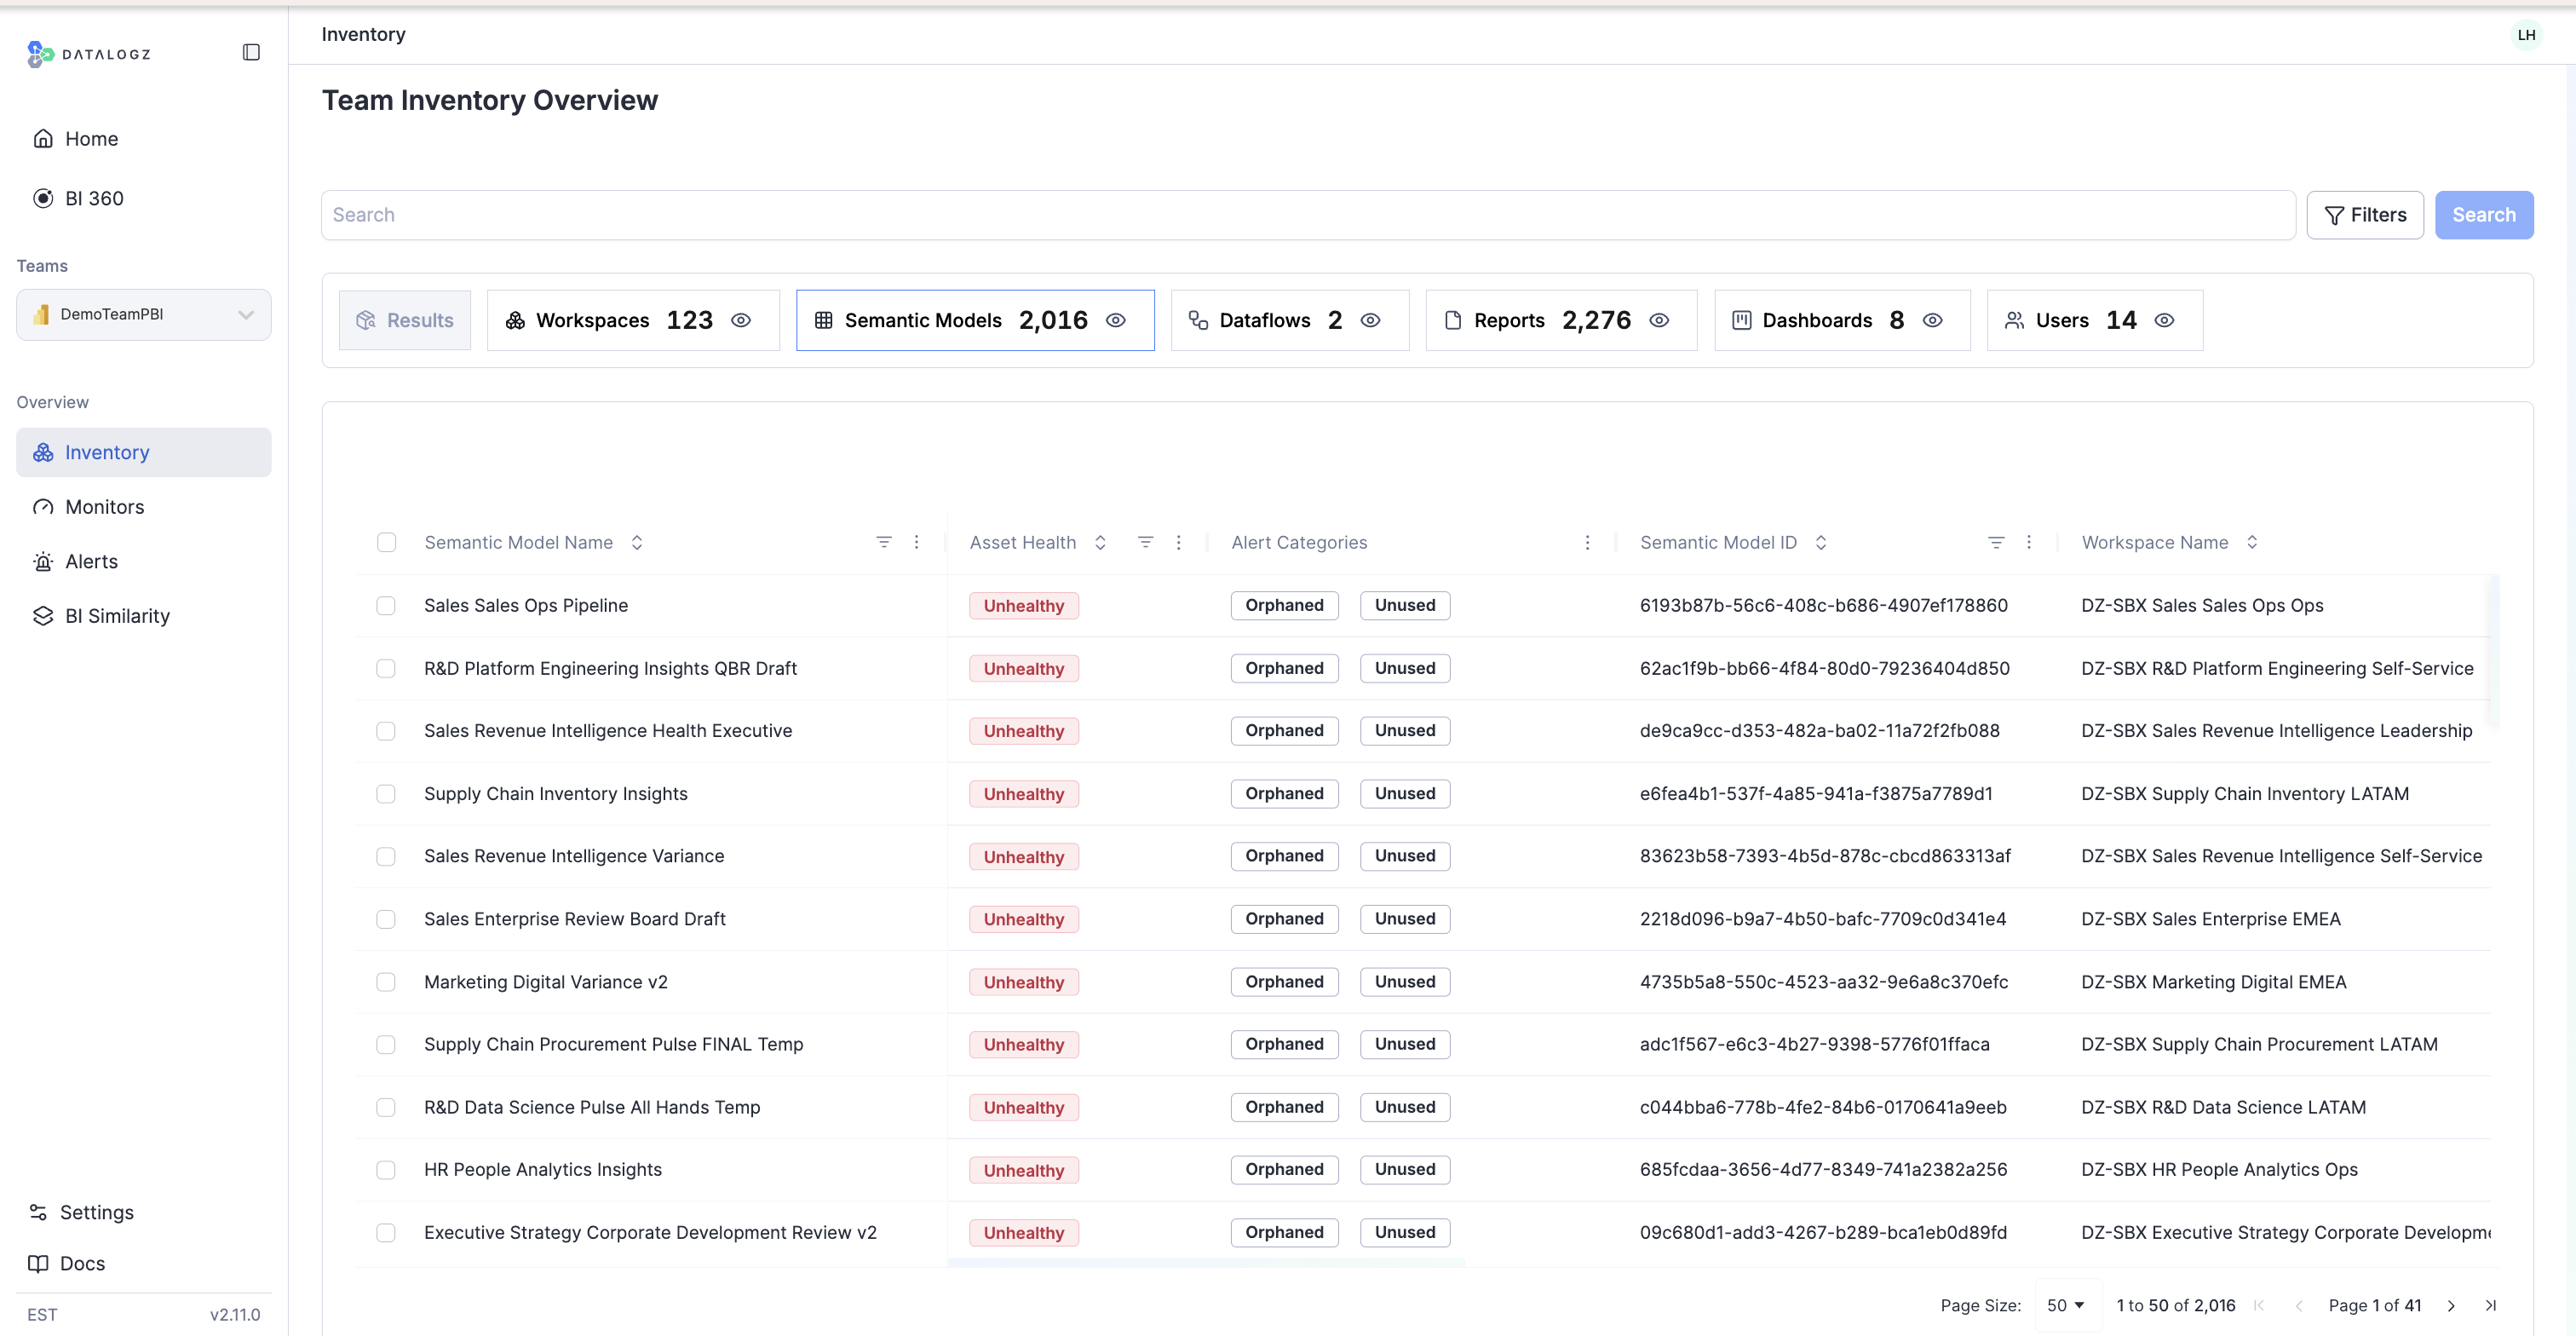
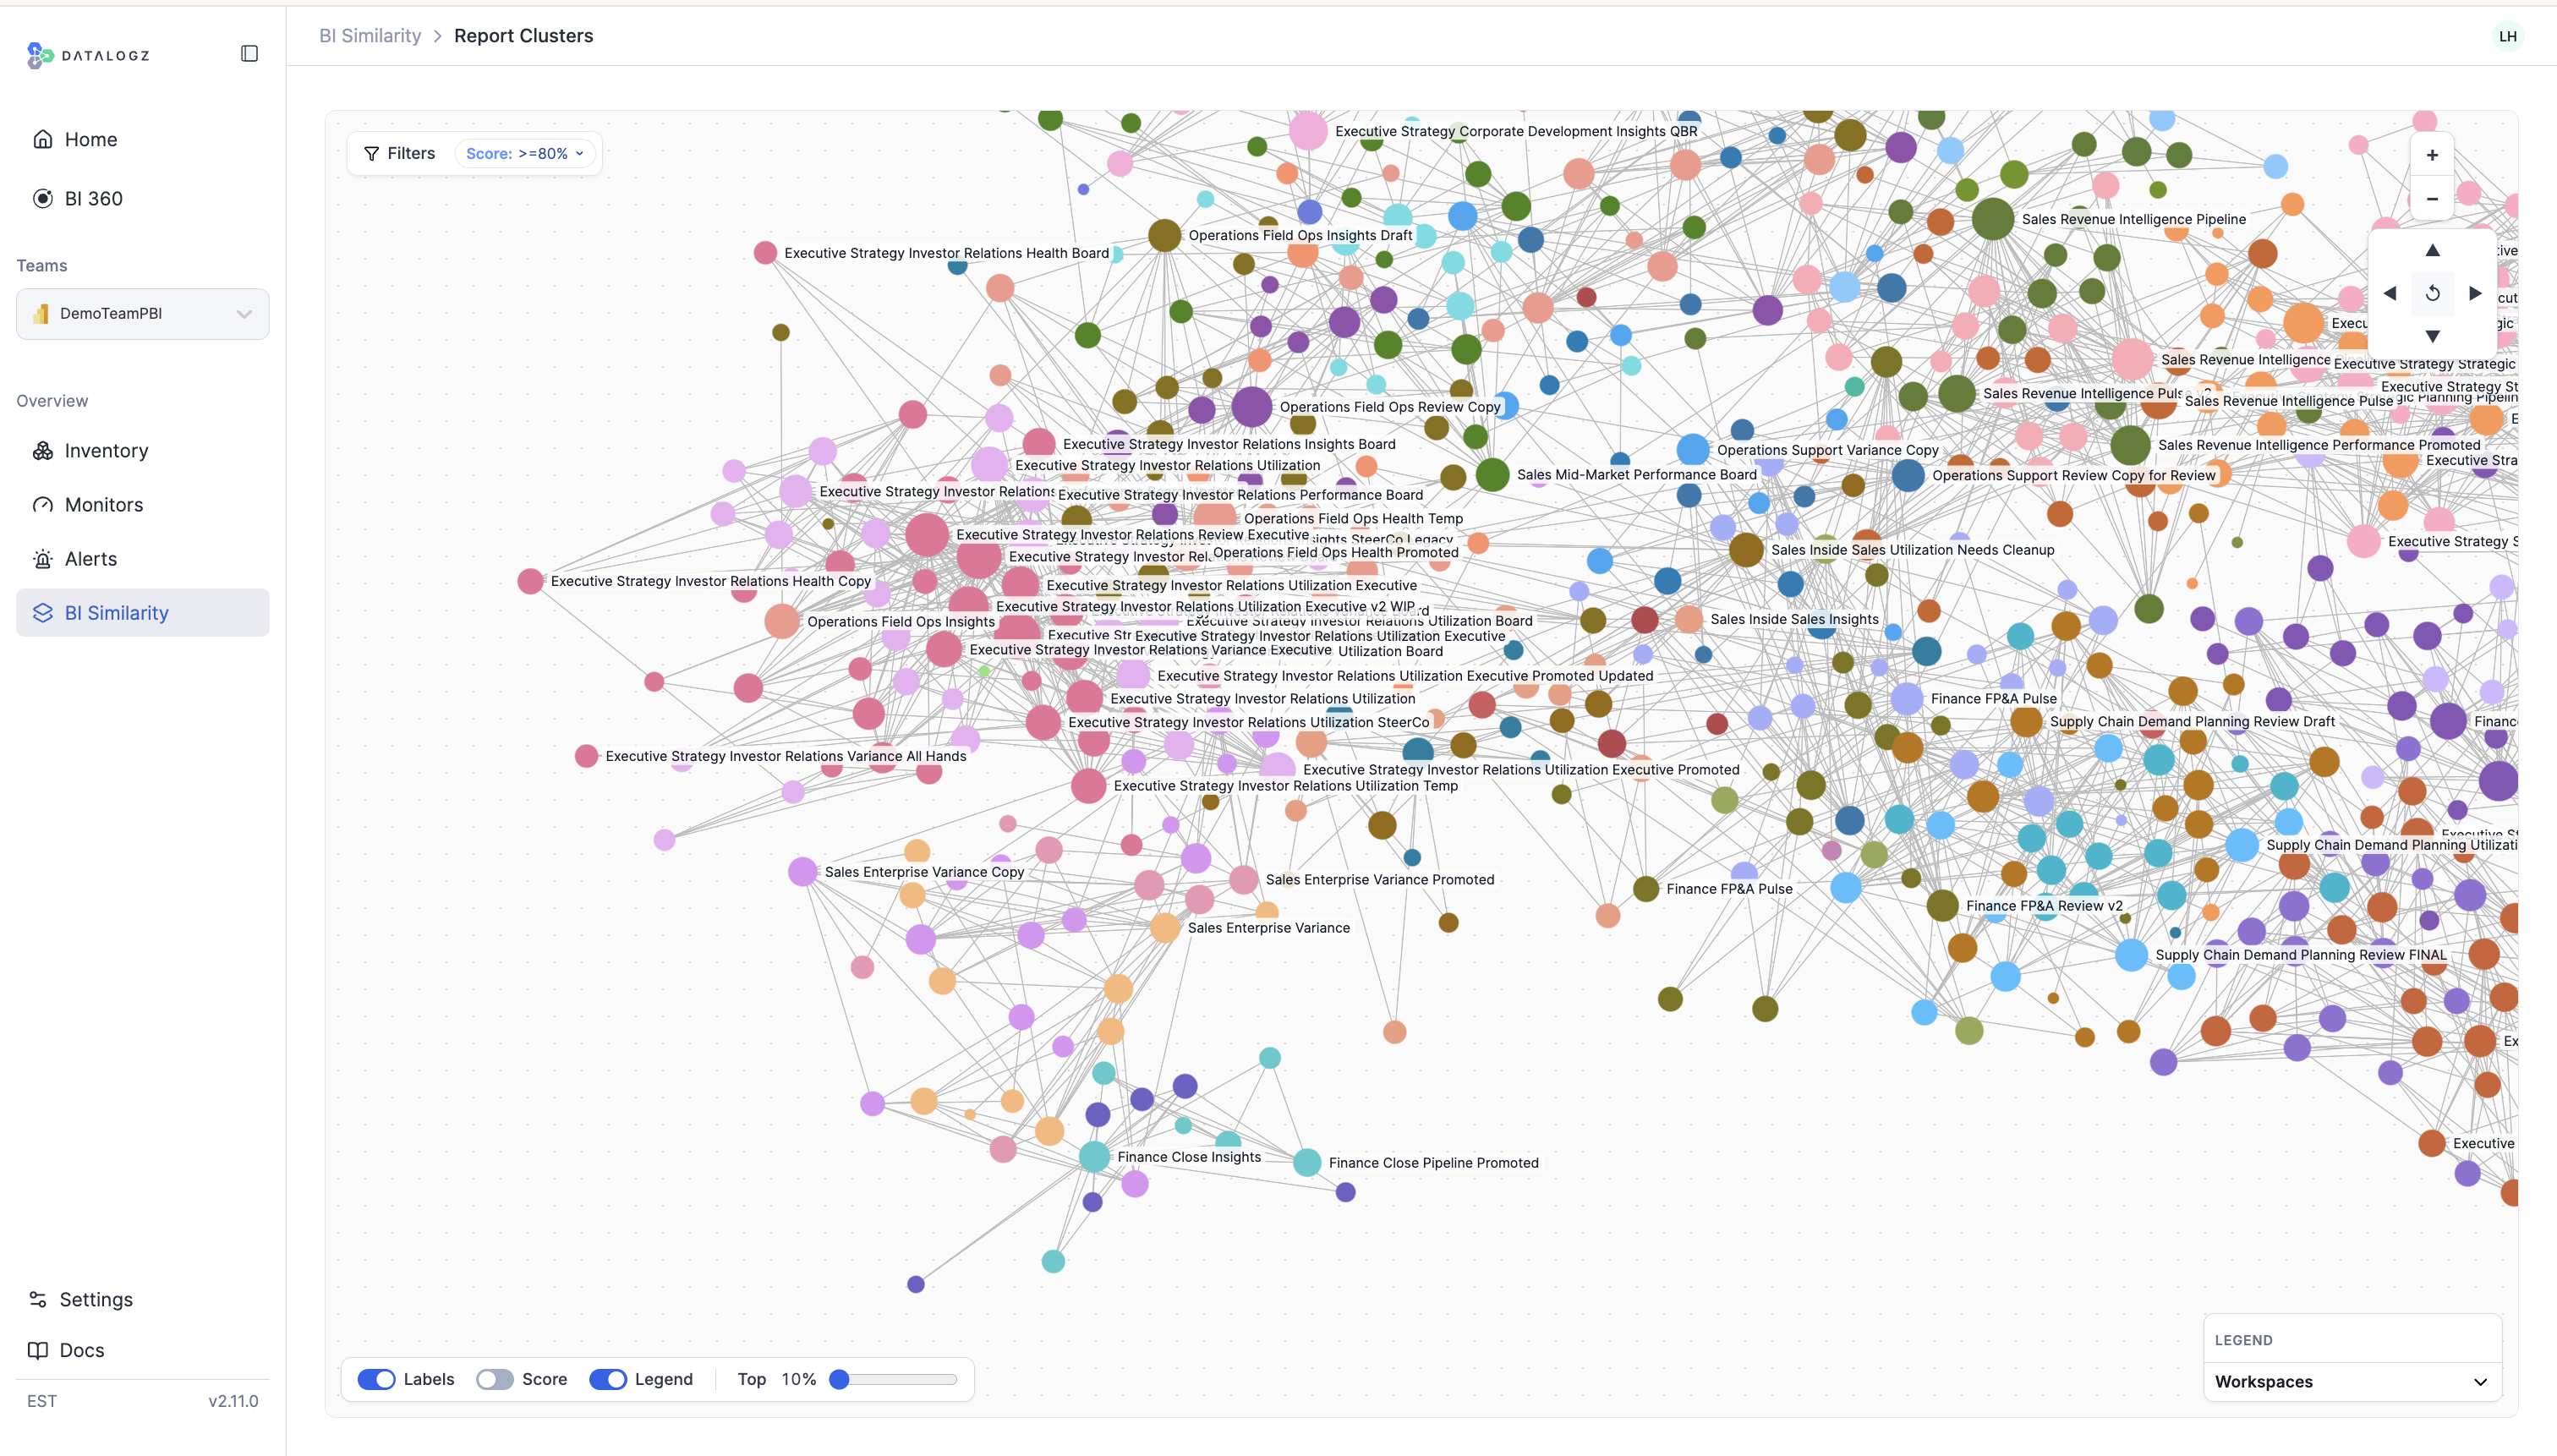
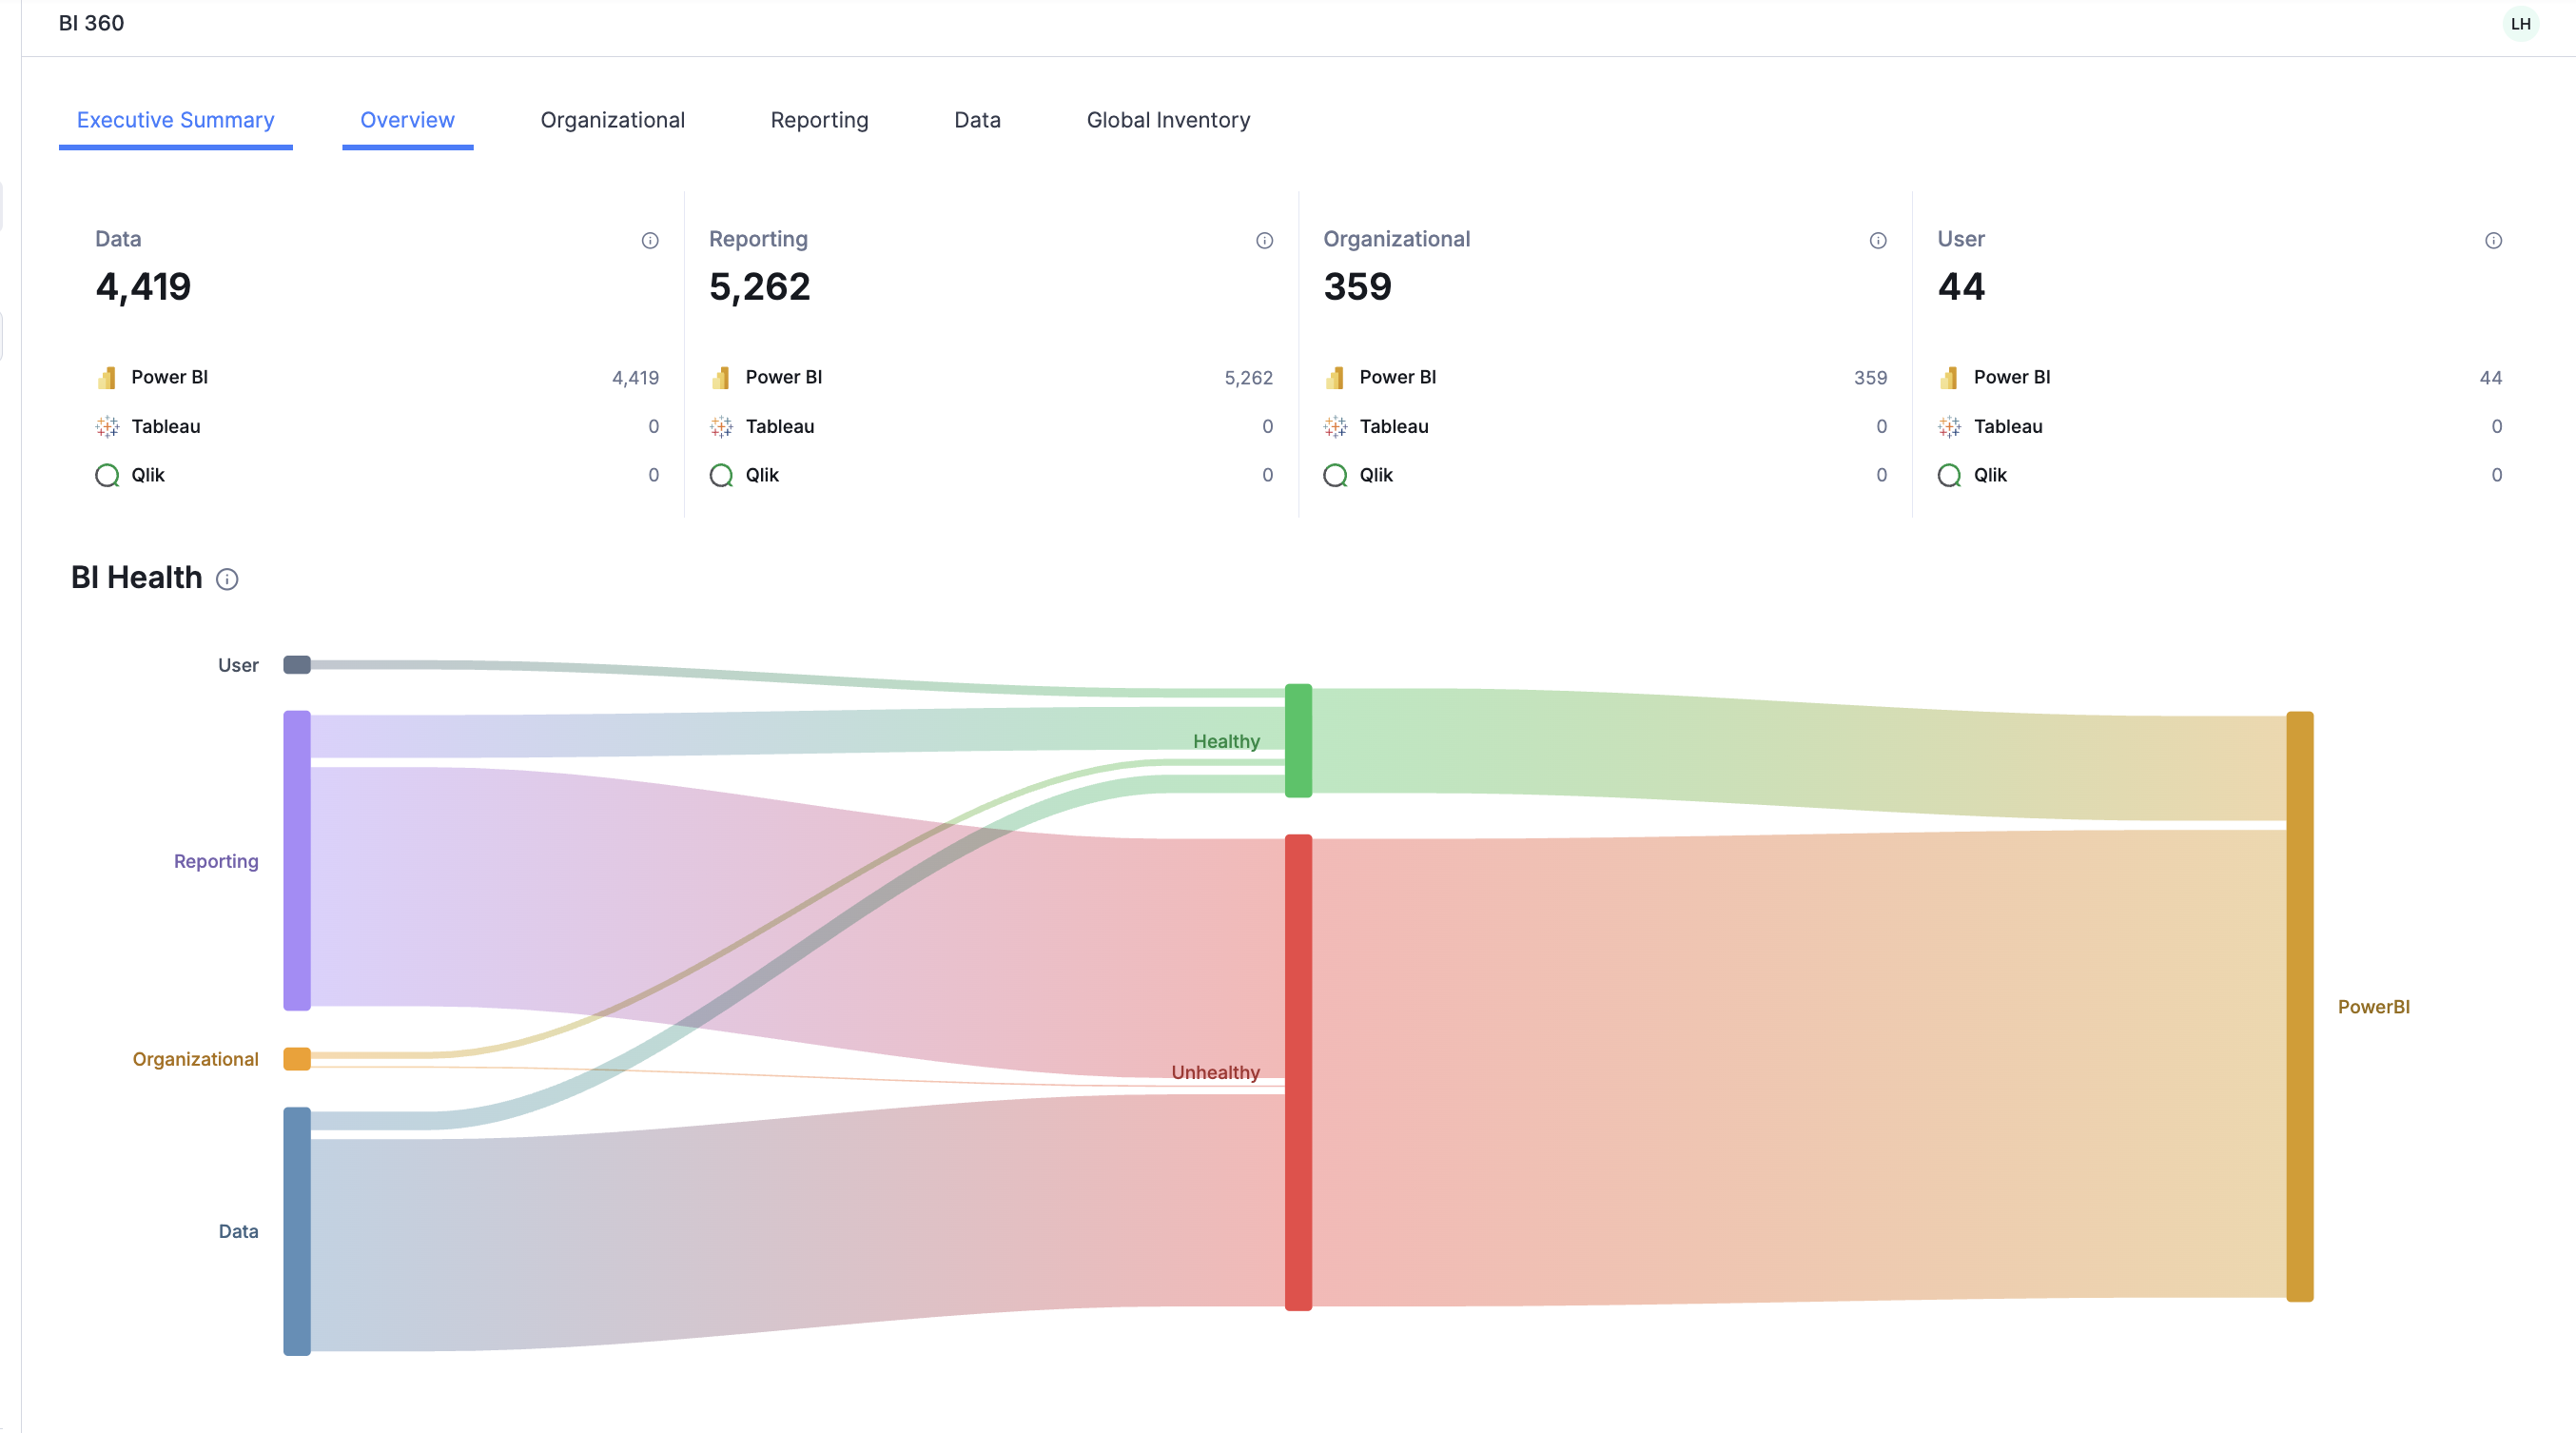
Datalogz finds the duplicate datasets, unused reports, and runaway refreshes silently inflating your Power BI, Fabric, Tableau, and warehouse spend, then automates the cleanup.
app.datalogz.io / bi-360 / overview
LIVE
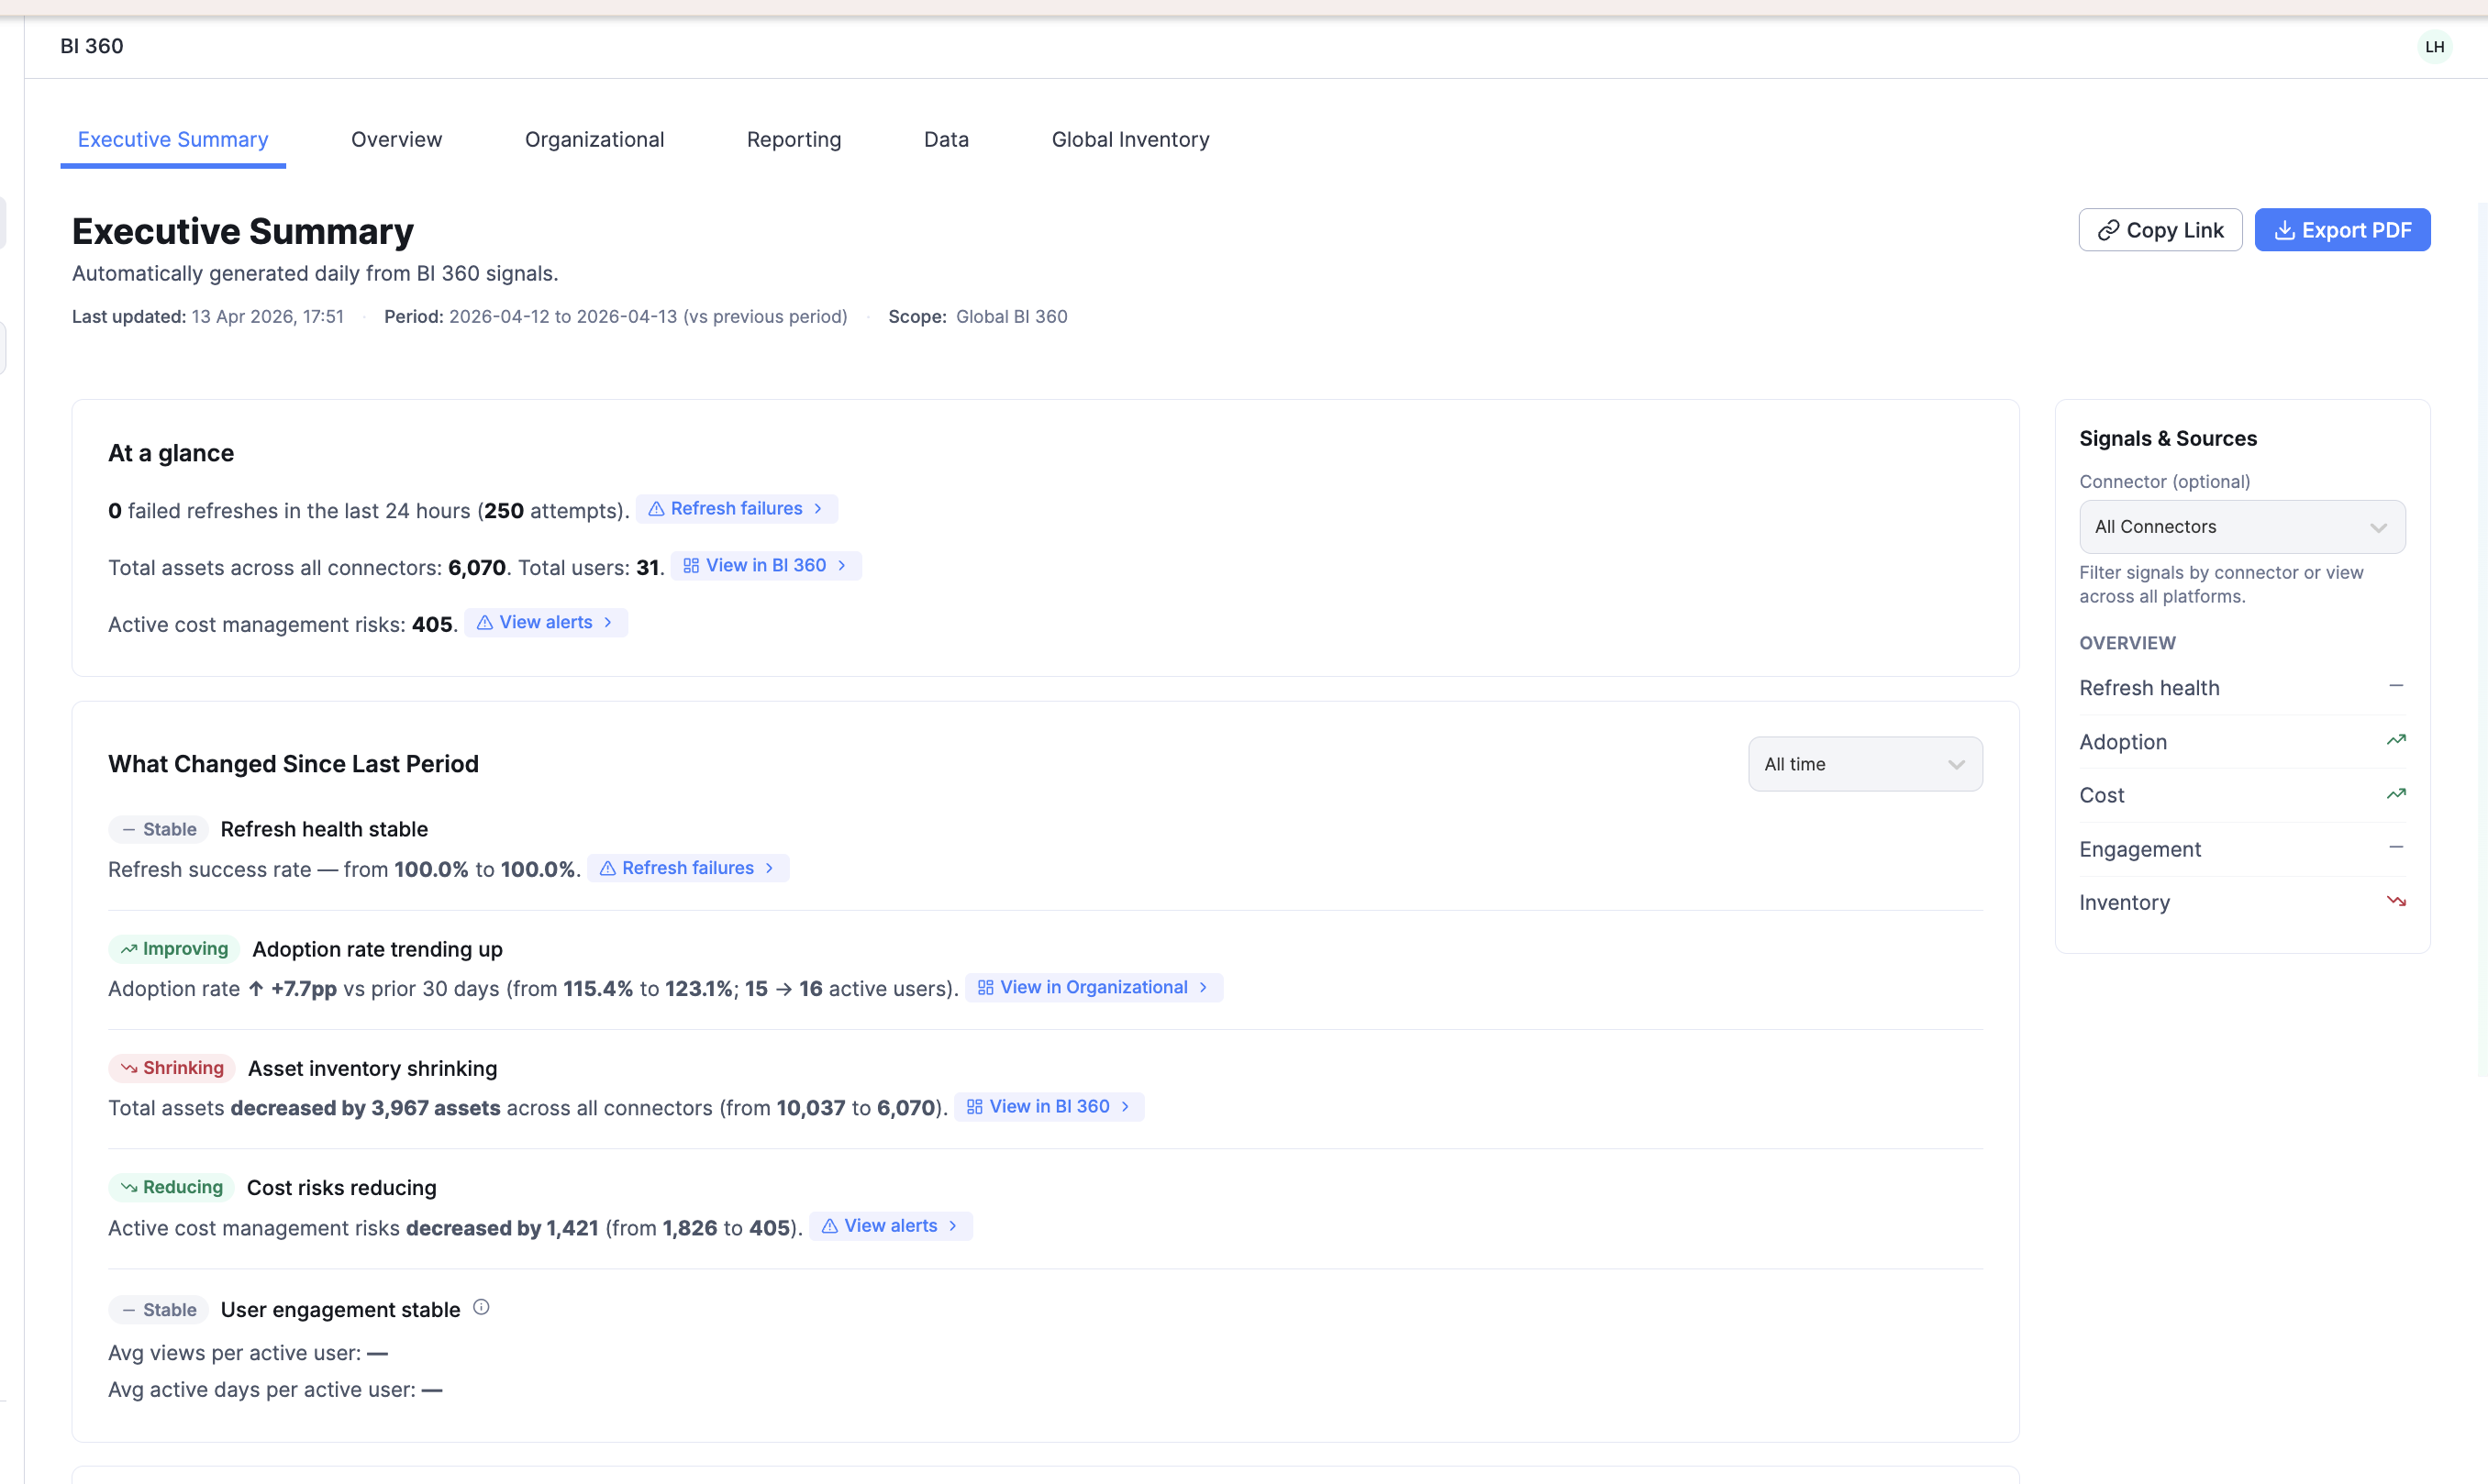
+ $1.5M savings identified in this view
Health drift detected · 4,419 datasets